SmugMug 2009, comparison with Flickr

Introduction

As you may know, I have left the Flickr service, where I had a Pro Account, for more than one year (in December 2008). Actually, I haven’t deactivated my Flickr account, it is “just” a normal account now, as I didn’t want to break different links on my photostreams. Some limitations are now appearing on my Flickr, i.e.:

  • upload of 100 MB monthly and 10MB per photo
  • 2 videos per month
  • only smaller resized picture accessible
  • only the most recent 200 photos are shown.

So, it is clear that I cannot use anymore this service. On the other side, it’s free!

Comparison Flickr vs. SmugMug

So let’s compare a bit more the different services (SmugMug and Flickr).

Disclaimer: this comparison is a mix of facts and my own subjective rating of both services (still as users from both during months).

CORPORATE FLICKR SMUGMUG
Overall information sold to Yahoo! in March 2005, founders left in 2008 independent, profitable and debt-free
Number of employees around 50 50
Number of photos 4’000 million 766 million
Founding year 2004 2002
STANDARD SERVICE FLICKR SMUGMUG
monthly upload limit 100 MB unlimited
limit per photo 10 MB 12 MB
max. video duration 90s not supported in “standard”
max. video size 150 MB not supported in “standard”
shown size (photo) smaller resized images no reducing resolution
number of photos shown last 200 unlimited
gallery personalization no yes, very nice
slideshows yes, but limited yes, lots of customization possible
costs per year free, but with ads $40
PRO SERVICE FLICKR SMUGMUG
monthly upload limit unlimited unlimited
limit per photo 20 MB 24 MB
max. video duration 90s 10 mn
max. video size 500 MB 600 MB
HD supported 720p 1080p
storage limit unlimited unlimited
bandwidth limit unlimited unlimited
statistics yes yes (far better)
customization no fully, including hostname
batch organization yes, but limited yes, extremely powerful
costs per year $25 $150 (an intermediary “Power” level exists for $60/year)

I am wondering, based on this tables, if it would not have been better to compare the “Pro” service from Flickr with the “Standard” level of SmugMug…

Anyway, you feel perhaps how far both services are different. Perhaps also not with the same target groups/segmentation of customers.

Why I have left Flickr

I have left Flickr for mainly three reasons:

  1. The huge functional differences between Flickr and SmugMug
  2. The lack of innovation and service updates at Flickr. In the last months, nothing happened at Flickr. SmugMug is principally launching new functions and testing new ideas each month!
  3. I was impacting by all the controversies and censorship stories (Thomas Hawk is relating some of them here and here) around Yahoo!/Flickr.

It is clear that the price differences is really huge between both services, but you get something from what you are paying!

Impact of having moved to SmugMug

First, it was quite easy to migrate from Flickr to SmugMug, as you can find a Firefox extension to automatically migrate all your pictures from your Flickr account to SmugMug. The tool is called “SmuggLr” and it is free.

Secondly, based on my SmugMug Pro Account, I have created a new subdomain called “visuals.didierbeck.com” of my own blog “www.didierbeck.com”. Both are now similar from each others, although I am definitely not finished with the customization. I will perhaps also merge both (blog and visuals) in the coming time. All my pictures and videos are now published under the “visuals” subdomains.

Thirdly, and perhaps the most interesting: the effect of having done these changes had a *huge* impact on the traffic of my pictures! I had about 18’000 views on my Flickr pictures within 2 years. I was many times above 100’000 views per month in 2009 on SmugMug! More data about this just below.

Some statistics of my SmugMug in 2009

Some data
about 2009 on visuals.didierbeck.com:

  • Number of image views: 755’000
  • Monthly average in the last 6 months: 105’000
  • Number of image views linked with Saint Barth: 620’000 (!), i.e. 82% of the overall views (!!)
  • Highest traffic in December with more than 130’000 image views
  • Highest image views in a day (since mid November): December 6 with 18’910 views in one day…
  • Bandwidth used during the year: 82 GB
  • Highest bandwidth usage in July with more than 20 GB
  • Most viewed photo since mid November (with about 8’500 views just on this one):


Visualization of the traffic during the last 12 months:

100’000+ photos viewed in August on my SmugMug account

As some of you have already observed, I have completely left my Flickr account since beginning of this year. For different reasons. I have to post about that too ;-)

I would like to mark this day because I have passed the 100’000 photos viewed on my SmugMug account within one month! These views have generated more than 16 GB of bandwidth usage for the same period (actually, exactly 29 days).

On my Flickr account, with about the same portfolio, I have today 18’341 views within … more than 2 years. Crazy, no?


All my photos and videos can be found under:

visuals.didierbeck.com

International IT market is resisting the downturn

via EITO

Despite the weakness in the international economy, demand for information technology (IT) will continue to increase in the coming year. According to the new forecast of the international market research institute EITO, turnover of computers, software and IT services in Western Europe will increase by 2 percent in 2009, to a round 315 billion Euro. “IT expenditure of businesses will continue to grow even in an economic recession”, said EITO chairman Bruno Lamborghini. “Information technology is of strategic importance for companies in a crisis situation because it makes operations more efficient and more economic.” Increasing demand for IT was also to be expected from contractors working in the public sector, where investment has limited dependence on economic fluctuations. According to the latest forecast, providers of software and IT services in Western Europe will achieve a substantial increase in turnover of 3.2 percent in the coming year, to 228 billion. In comparison, manufacturers of IT hardware are facing a loss of 1.3 percent, to 87 billion Euro.

The EITO market researchers are expecting development of the IT market in Western Europe, which includes the 15 core countries of the EU with the addition of Switzerland and Norway, to be more robust than in the USA. IT turnover in the United States is forecast to grow by 0.8 percent to 347 billion Euro. Before the global financial crisis became more acute, EITO was assuming growth of the IT market at a level of 4.4 percent in the USA.

The global IT market for the year 2009 will grow, according to the EITO forecast, by 2.7 percent to 983 billion Euro. As in Europe, suppliers of software and IT services around the world are growing particularly strongly. Their turnover world-wide is forecast to grow by 3.4 percent to 677 billion Euro in the coming year. The hardware market is increasing by 1.3 percent to 305 billion Euro. The driving forces are emerging markets like China, India and Russia, which still have some ground to make up in developing their IT infrastructure.

So, summarized, concerning turnover forecast for 2009

  • Worldwide:
    • Overall: +2.7%
    • Software and IT services: +3.4%
    • IT Hardware: +1.3%
  • Western Europe (15 EU countries, Switzerland, Norway)
    • Overall: +2.0%
    • Software and IT services: +3.2%
    • IT Hardware: –1.3%
  • USA:
    • Overall: +0.8%
  • Western Europe more robust than in the USA
  • Driving forces internationally: China, India, Russia (generally speaking: emerging markets)

Statistics about average webpage size

via WebSiteOptimization.com

A post from April 2008, but still very interesting. Some good indications if you would like to compare your own web-production with some average figures.

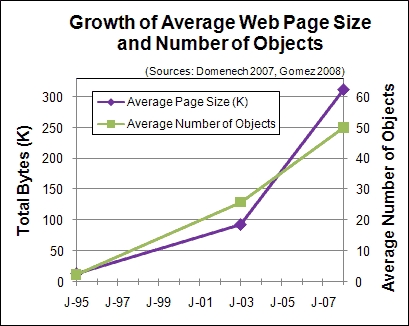
Average webpage size triples since 2003


webpage size

From 2003 to 2008 the average web page grew from 93.7K to over 312K, some 233%.

During the same five-year period, the number of objects in the average web page nearly doubled from 25.7 to 49.9 objects per page.

Longer term statistics show that since 1995 the size of the average web page has increased by 22 times, and the number of objects per page has grown by 21.7 times.

Response time trends


For broadband users the average download time of the Keynote Business 40 Internet Performance Index (KB40) has decreased from 2.8 to 2.33 seconds from Feb. 2006 to Feb. 2008

So the increase in the average speed of broadband has more than kept pace with the increase in the size and complexity of the average web page. That is one reason why broadband users expect faster response times. Yet narrowband users have experienced slower response times as web page size has increased.

Use of Javascript


In the 2007 survey, 84.8% of web pages used the script element.

The average size of external scripts was 8,845 bytes uncompressed, and 6,302 bytes compressed. Total script size was 68,812 bytes uncompressed and 49,738 bytes compressed.

The average number of external scripts was 7, where 6 of which were unique.

Use of CSS


In the 2007 survey, 82.4% used the link tag, and 54.5% used the style tag (with an average of 2.27 style tags used internally).

The average size of external style sheets was 6,575 bytes, and 4,457 bytes compressed. The total average style size was 15,175 bytes uncompressed, and 10,347 bytes compressed.

Use of images


Images were used in 91.6% of web pages in the 2007 survey.

Quite useful!

Impressive figures from the Linux kernel development

via 451 CAOS Theory

Great post about some impressive figures from the Linux kernel development.

  • There have been almost 10,000 patches in each recent quarterly Linux kernel release.
  • Releases include work from ~1,000 developers and ~100 companies.
  • Since 2005, Linux has had more than 3,600 individual developers and more than 250 companies contributing to the kernel.
  • The individual development community has tripled in the last three years.
  • The top 10 developers have contributed 15% of changes, and the top 30 developers have contributed 30% of changes to the kernel.
  • Linus Torvalds is 27th on the list of contributors with most changes over the last few years. He has 495 to his name.
  • More than 11,500 or 14% of kernel changes have come from developers with no commercial entity backing their Linux development.
  • Another 13% of changes come from developers with ‘unknown’ commercial affiliation.
  • When we get to actual companies, Red Hat leads with 9,351 kernel changes, or 11.2%. Next is Novell with 8.9%, IBM with 8.3% and Intel with 4.1% of kernel changes.
  • More than 70% of all kernel development is demonstrably done by developers who are being paid for their work.
  • From the 2.6.11 kernel to the 2.6.24 release (1,140 days), there were an average of 2.8 accepted patches applied to the Linux kernel tree per hour.
  • An average of more than 3,600 lines of code is added to the Linux kernel tree every day.
  • Since 2005, the kernel has grown at a steady rate of 10% per year.

Gosh, if this is not showing the incredible health and dynamism of the Linux community!

cross-posted on the innoveo blog.

Blog statistics 2007

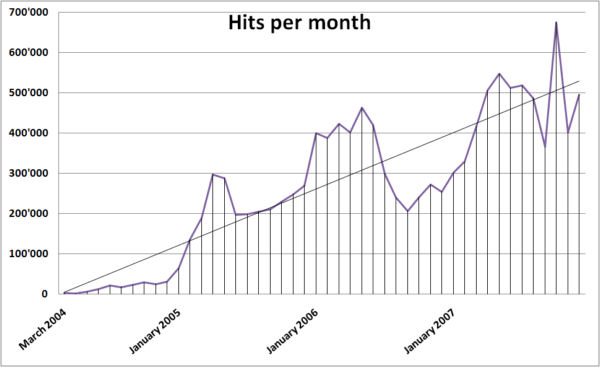
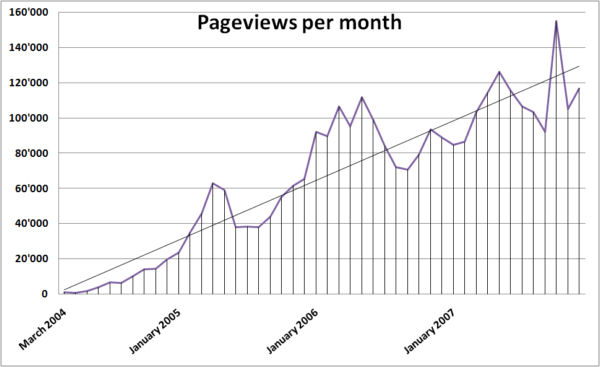
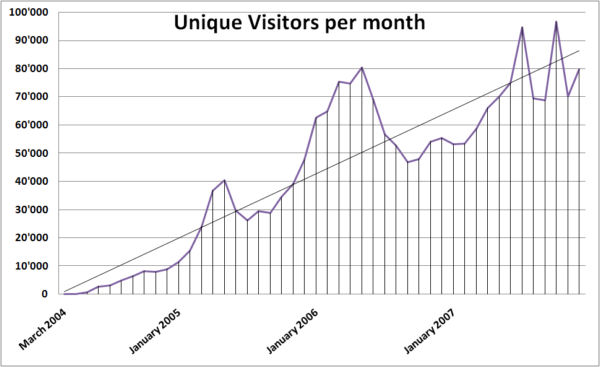
As usual, I would like to give you transparently some information about what was going on there, on this blog, in 2007. And since the start of this blog in March 2004.

Statistics 2007

  • Number of hits: 5,6 million (best day: 42’807 hits)
  • Number of pageviews: 1.3 million (best day: 10’648 pageviews)
  • Number of visitors: 0.9 million (best day: 14’314 visitors)
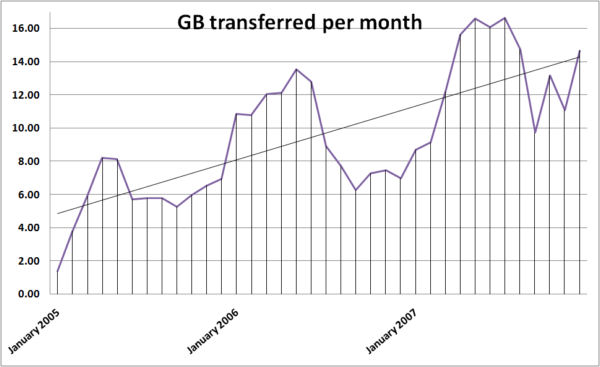
  • Bandwidth: 158 GB
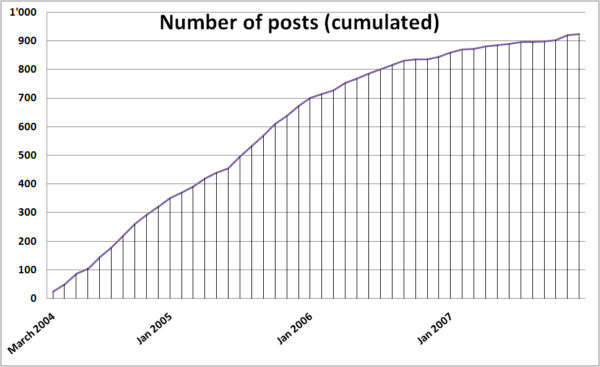
  • Number of posts: 80
  • 100 countries with more than 50 visitors in 2007
  • 7% of the visitors are coming from China (wow) and … 2.5% from France ;-)
  • Browsers: IE – 56%, Firefox – 24%, Safari – 3%, Opera – 2%

Overview 2004-2007

  • Number of hits: 12.3 million
  • Number of pageviews: 3.1 million
  • Number of visitors: 2.0 million
  • Bandwidth: 346 GB
  • Number of posts: 923

dbw statistics 2007

dbw statistics 2007

dbw statistics 2007

dbw statistics 2007

dbw statistics 2007