A post from April 2008, but still very interesting. Some good indications if you would like to compare your own web-production with some average figures.
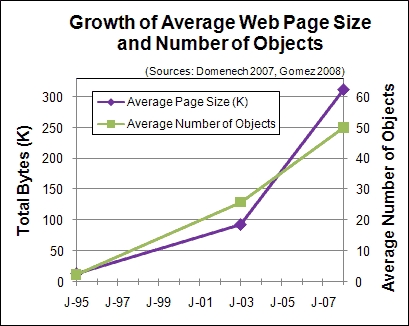
Average webpage size triples since 2003

From 2003 to 2008 the average web page grew from 93.7K to over 312K, some 233%.
During the same five-year period, the number of objects in the average web page nearly doubled from 25.7 to 49.9 objects per page.
Longer term statistics show that since 1995 the size of the average web page has increased by 22 times, and the number of objects per page has grown by 21.7 times.
Response time trends
For broadband users the average download time of the Keynote Business 40 Internet Performance Index (KB40) has decreased from 2.8 to 2.33 seconds from Feb. 2006 to Feb. 2008
So the increase in the average speed of broadband has more than kept pace with the increase in the size and complexity of the average web page. That is one reason why broadband users expect faster response times. Yet narrowband users have experienced slower response times as web page size has increased.
Use of Javascript
In the 2007 survey, 84.8% of web pages used the script element.
The average size of external scripts was 8,845 bytes uncompressed, and 6,302 bytes compressed. Total script size was 68,812 bytes uncompressed and 49,738 bytes compressed.
The average number of external scripts was 7, where 6 of which were unique.
Use of CSS
In the 2007 survey, 82.4% used the link tag, and 54.5% used the style tag (with an average of 2.27 style tags used internally).
The average size of external style sheets was 6,575 bytes, and 4,457 bytes compressed. The total average style size was 15,175 bytes uncompressed, and 10,347 bytes compressed.
Use of images
Images were used in 91.6% of web pages in the 2007 survey.
Quite useful!


